Observations
Of the total 72965 studied buildings, 5784 (8.61%) are vandalized, while the remaining 67181 are free of graffiti. Each building can contain more than one act of vandalism. The following is a heatmap of the existing graffiti on each building in Vancouver, where darker colours indicate more graffiti on a particular building:
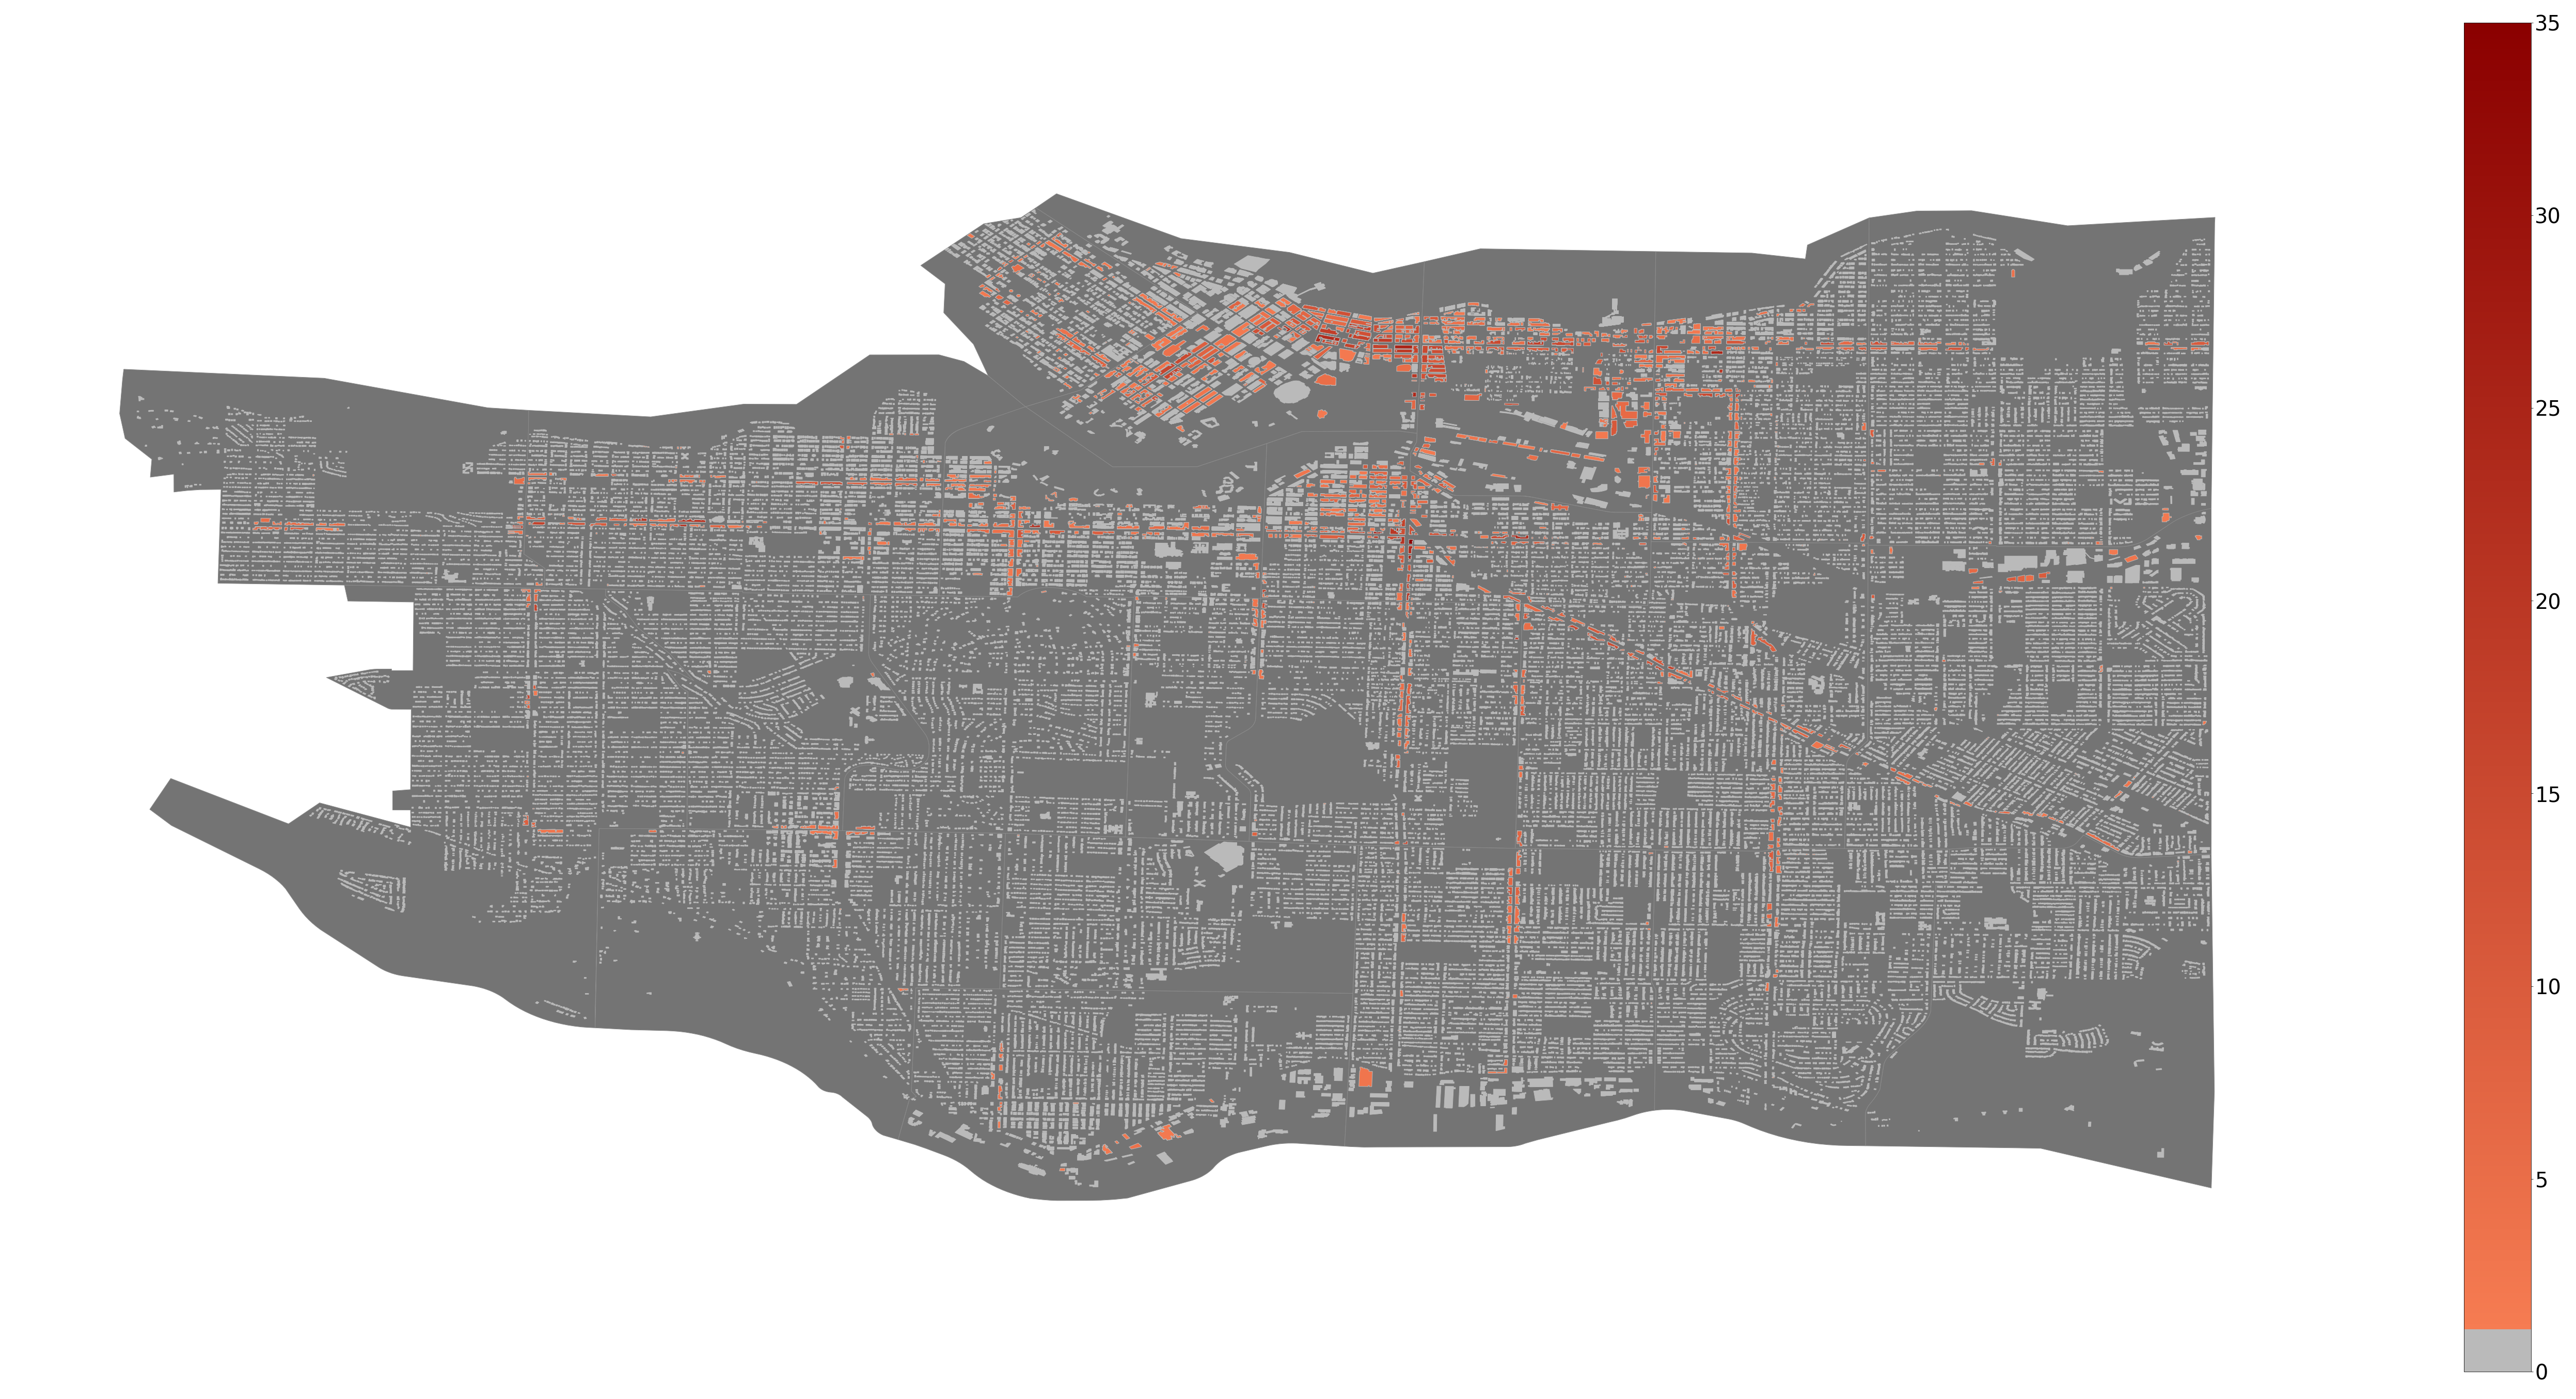
Fig. 2.1. Heatmap of existing graffiti on buildings in Vancouver.
If we study the buildings with graffiti on them, we see an exponential drop off in the distribution of graffiti. This means that most vandalized buildings have only one graffiti on them.
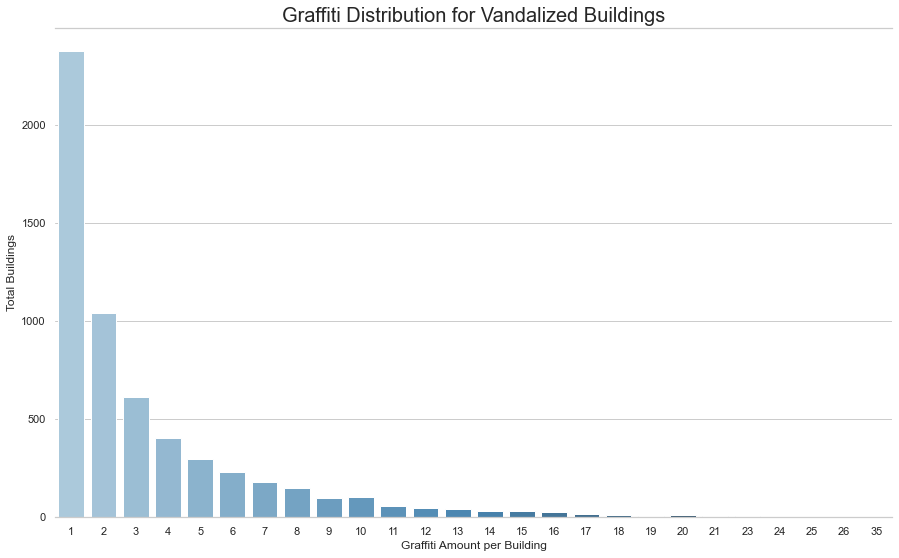
Fig. 2.2. Graffiti distribution of vandalized buildings.
Most of the graffiti is located in the North East area of Vancouver, namely in Downtown, Strathcona, Grandview-Woodland, and Mount Pleasant. While we do not focus on the local area itself, our results do consider certain characteristics of each area, such as the population and the physical area.
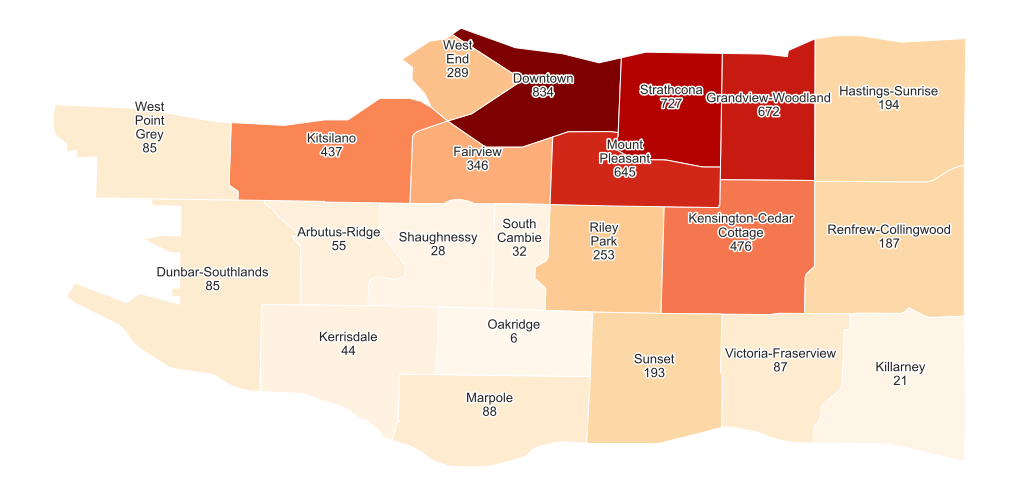
Fig. 2.3. Counts of graffiti buildings in each local area.
We will also be taking street data into account. A huge portion of all graffiti can be found on major streets. In the figure below, the top 10 most graffitied streets contain almost 50% of all graffiti in Vancouver. Most vandalized buildings are on Main Street, East Hastings Street, and Kingsway. These three streets alone contain a quarter of the reported graffiti.
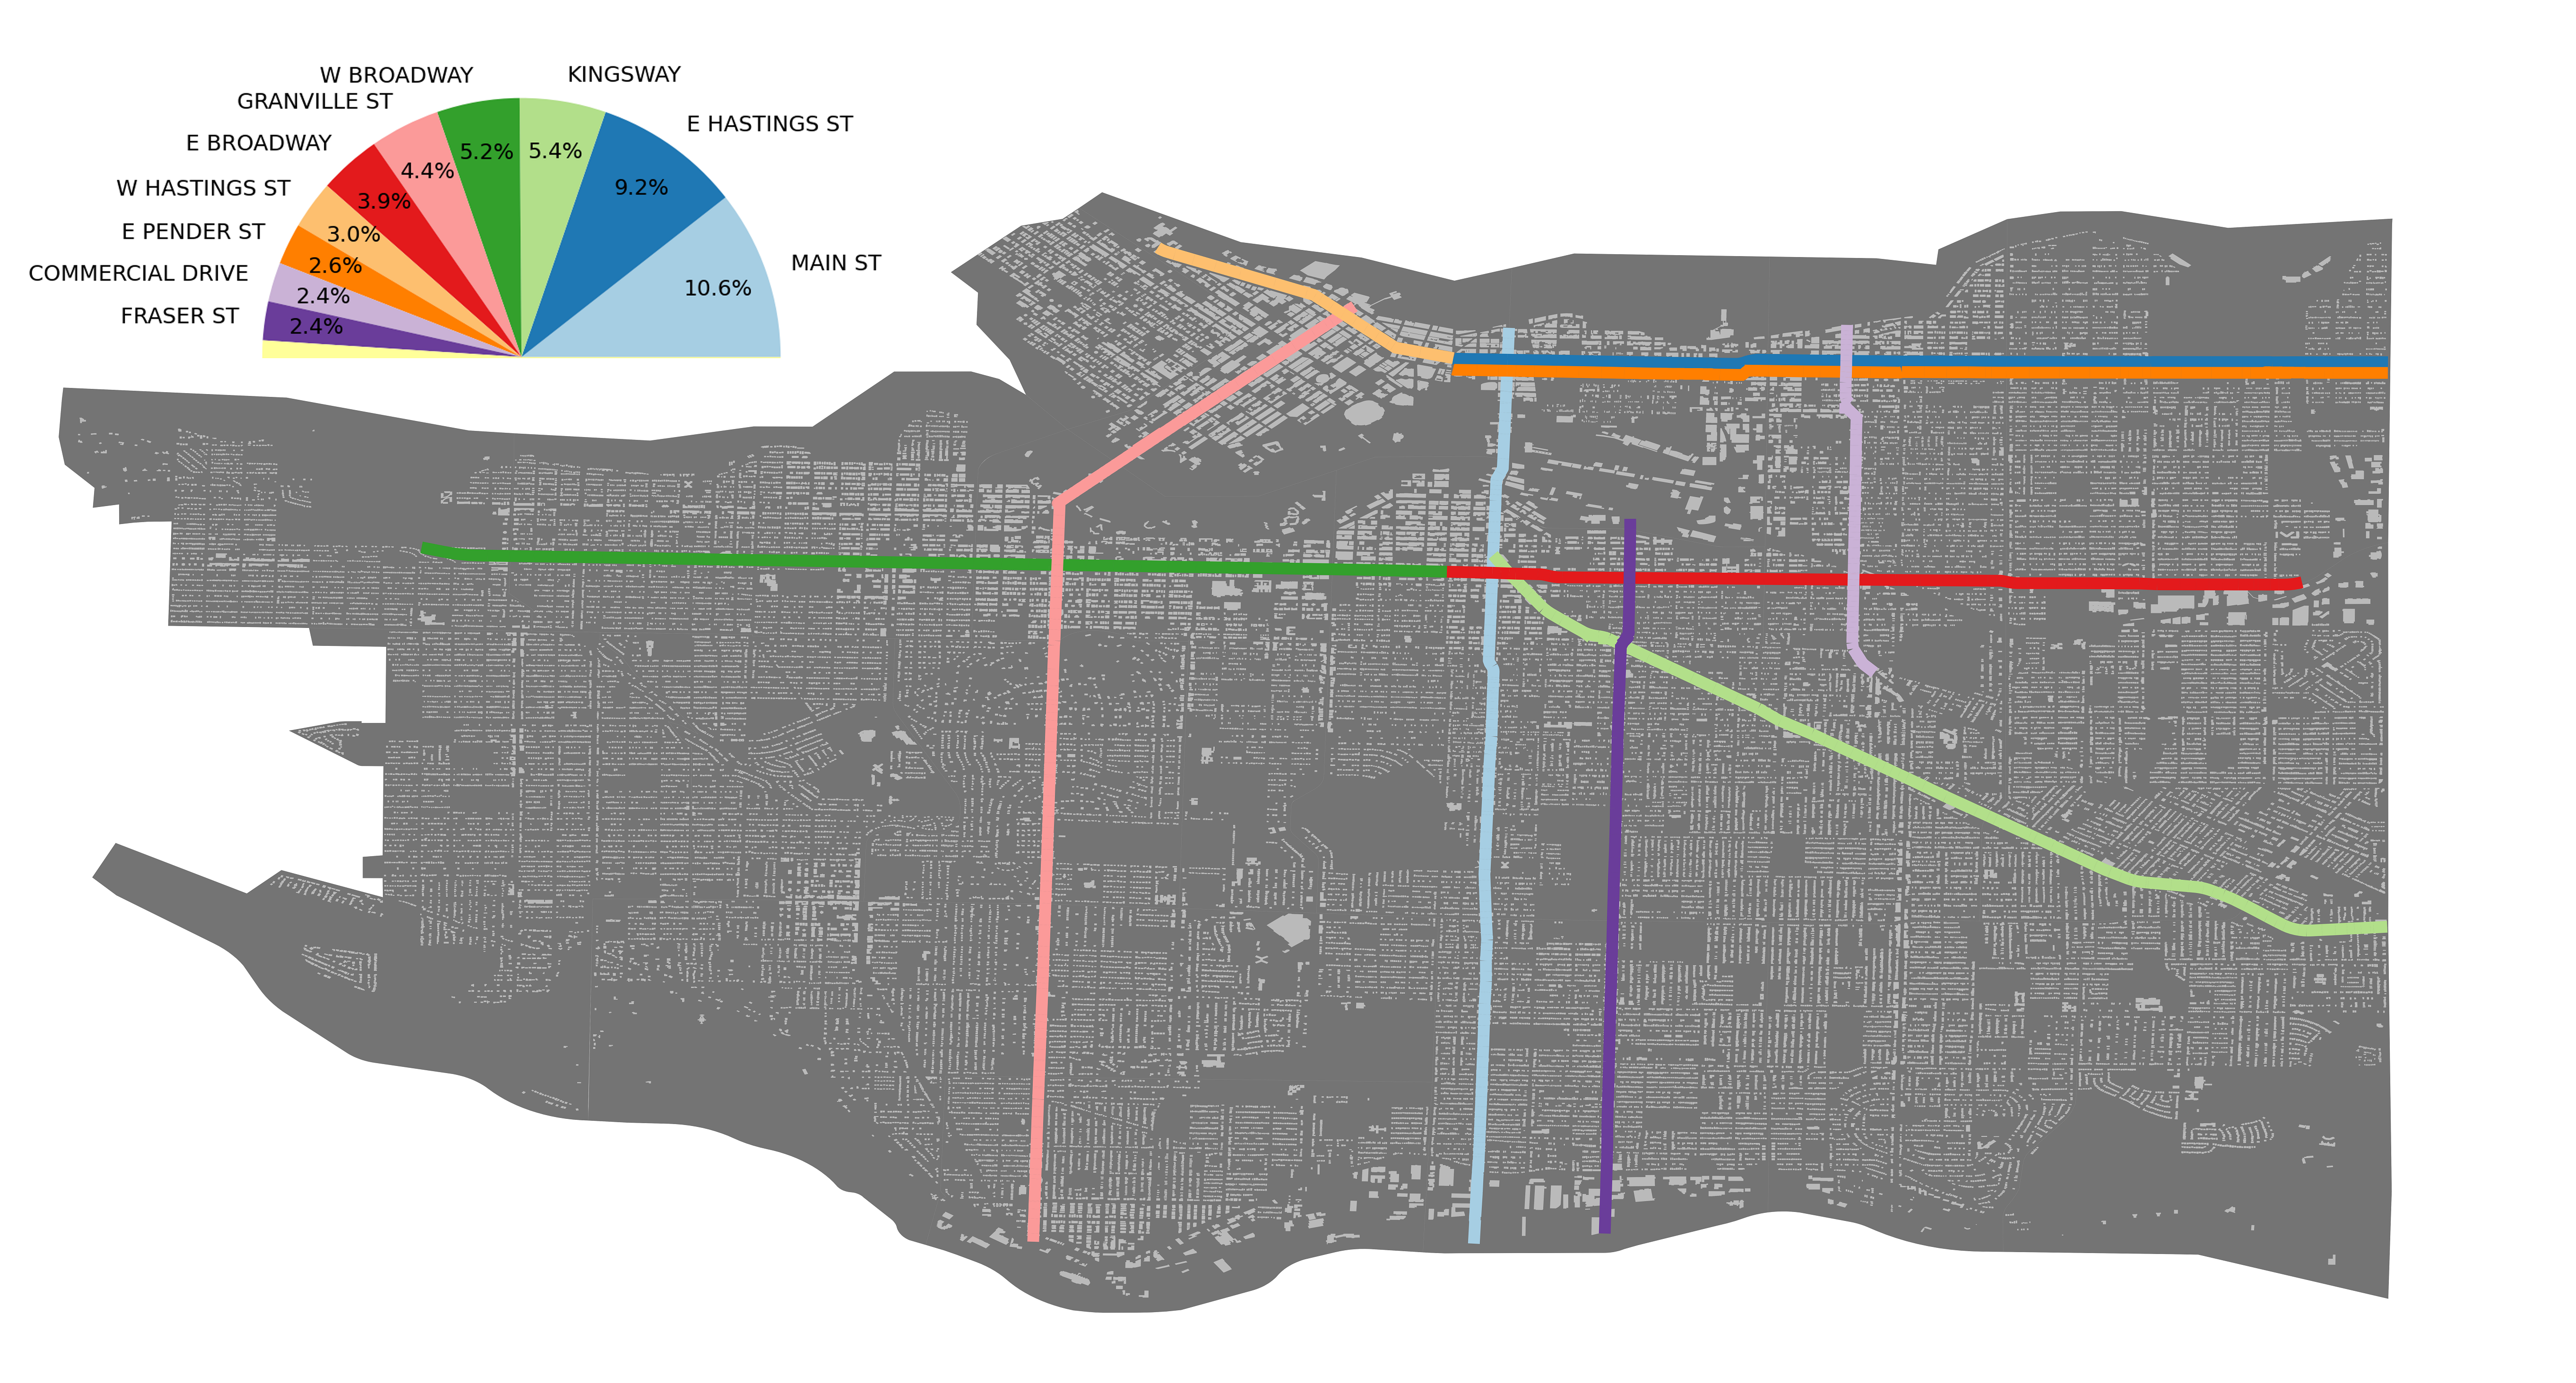
Fig. 2.4. 10 most graffitied streets.
Similar to local areas, we do not focus on individual streets, but we do consider street details, specifically the type of street. From the following visualisation we can see that, while there are many more residential roads, if a building lies in an arterial street, it has a much higher chance of being vandalized.
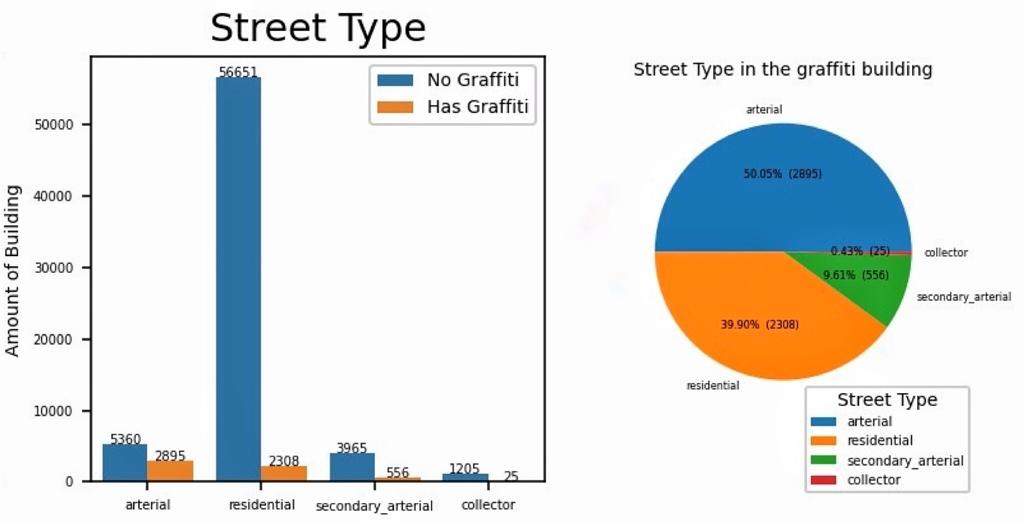
Fig. 2.5. Street types with and without graffiti on the building.
Our models also take other building properties into account, such as the height, area, and roof type. From the below visualisation, we can see that although there are many more pitched roof types, there is a higher chance for a building with a flat roof to be vandalized than any other type of building. 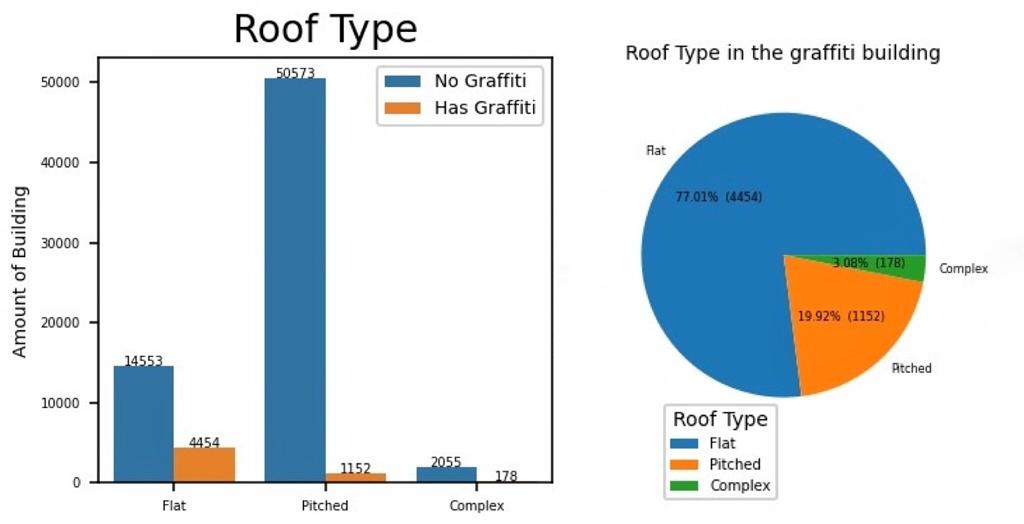
Fig. 2.6. Roof types with and without graffiti on the building.